

U.S.-Iran Peace Pact & Hormuz Transit Deal: Timeline, Market Impact, and Nifty Outlook
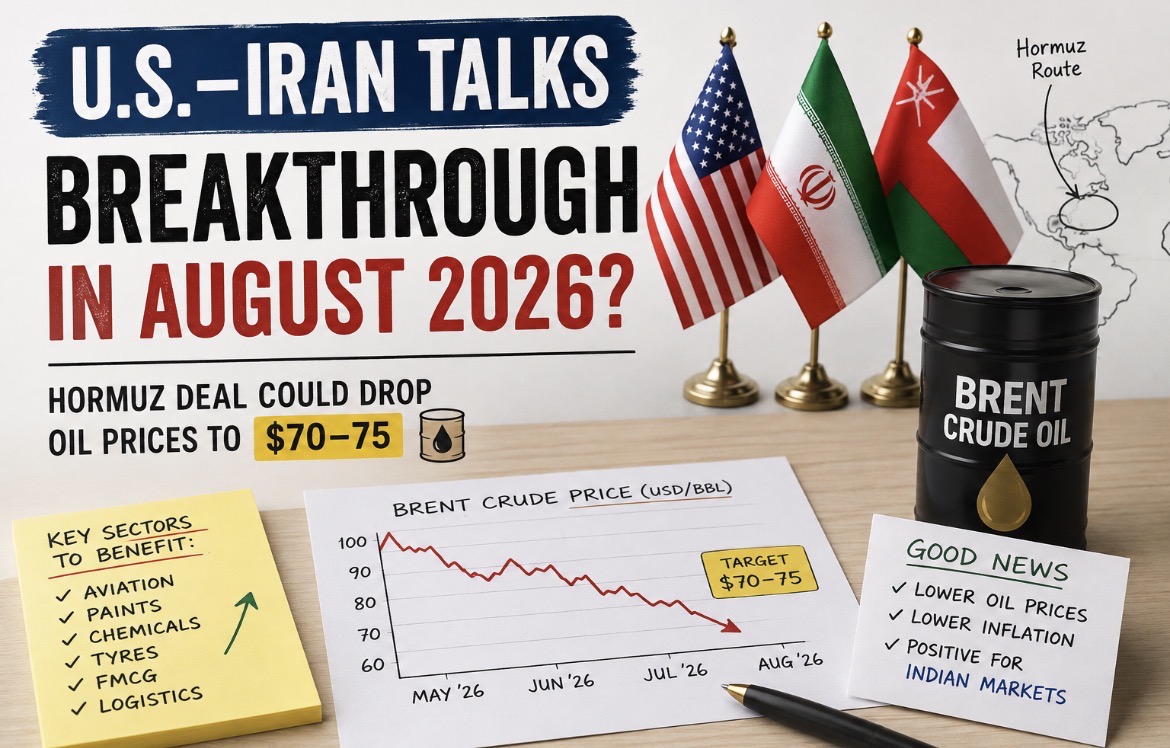
Global financial markets are locked onto the Middle East as diplomatic efforts mediated by Oman reach a critical juncture. The United States and Iran are finalising terms for a secured maritime corridor through the Strait of Hormuz the choke point through which roughly 20% of global petroleum transit flows.
Because India imports nearly 85% of its crude oil requirements, any stabilization in the Persian Gulf acts as an immediate macroeconomic tailwind. A resolution directly impacts India trade deficit, foreign exchange reserves, retail inflation, and the benchmark Nifty 50 and BSE Sensex indices.
Below is a detailed breakdown of the expected deal dates, diplomatic structure, and sector-by-sector implications for the Indian stock market.
Expected Timeline and Phases for the U.S.A Iran Deal
According to diplomatic sources and international briefings, the agreement is structured in two distinct phases:
Phase 1: Hormuz Transit Route Accord (Early August 2026)
- Expected Window: First to Second Week of August 2026
- Current Status: Mediated by Oman, Iranian and U.S. representatives have established baseline technical coordinates for commercial vessel transit through the Strait. Official joint statements regarding route parameters are imminent.
Phase 2: Comprehensive Ceasefire & Sanction Framework (Late August – September 2026)
- Expected Window: August 15 to August 31, 2026
- Current Status: Once initial maritime transit stabilizes without security breaches, talks will expand toward formalizing sanction relief mechanisms, lifting naval blockades, and establishing regional security guarantees.
Scenario Analysis: Market & Economic Impact
+——————————————————————————-+
| U.S.-IRAN DEAL OUTCOMES |
+—————————————+—————————————+
| SCENARIO A: DEAL DONE | SCENARIO B: TALKS FAIL |
| * Crude Drops: $70 – $75 / bbl | * Crude Spikes: $95 – $100+ / bbl |
| * Nifty Surge: +250 to +600+ Points | * Nifty Decline: -350 to -750 Points |
| * Rupee Strengthens | Inflation Drops| * Rupee Weakens | FII Outflows |
+—————————————+—————————————+
Scenario A: Deal Finalized (Bullish Macro Trigger)
A signed accord removes immediate supply disruption risks, unlocking structural relief across Indian equities:
- Crude Oil Price Movement: Brent crude is expected to drop from the $80 $85 range down toward $70 $75 per barrel or lower.
- Index Response (Nifty 50 / Sensex): A drop in crude is the single largest macro-economic booster for India. The Nifty 50 could see an immediate surge of +1.0% to +2.5% (+250 to +600+ points).
- Currency & Inflation: Lower import bills reduce India’s Current Account Deficit (CAD), strengthening the Indian Rupee (INR) against the U.S. Dollar. Reduced freight costs suppress retail inflation, expanding headroom for Reserve Bank of India (RBI) rate cuts.
Sector-Wise Key Beneficiaries:
- Paints & Specialty Chemicals: Companies like Asian Paints and Berger Paints rely on crude derivatives for raw material inputs. Falling oil prices directly expand operating margins.
- Aviation: Jet fuel (ATF) accounts for 35% 40% of operational costs for carriers like InterGlobe Aviation (IndiGo). Cheaper crude lowers input expenditures significantly.
- Tyres & Automotive: Synthetic rubber and key carbon compounds become cheaper, driving cost efficiency for auto manufacturers and component makers.
- Oil Marketing Companies (OMCs): HPCL, BPCL, and IOCL benefit from stabilized refining and marketing margins.
Scenario B: Talks Collapse (Bearish Pressure)
If negotiations stall or regional hostilities resume:
- Crude Oil Price Movement: Supply deficit fears could drive Brent crude rapidly above $95 $100+ per barrel.
- Index Response (Nifty 50 / Sensex): Elevated input costs would weigh on sentiment, dragging the Nifty 50 down by -1.5% to -3.0% (-350 to -750+ points) in a broad risk-off sell-off.
- Foreign Institutional Investor (FII) Outflows: Geopolitical uncertainty typically prompts FIIs to pull capital out of Emerging Markets to reallocate toward safe-haven assets such as U.S. Treasuries or Gold.
Strategic Matrix: Timeline vs. Market Movements
| Phase / Outcome | Expected Window | Estimated Brent Crude | Potential Nifty 50 Impact | Key Market Drivers |
| Phase 1: Transit Route Deal | Early August 2026 | $70 $75 / bbl | +250 to +600 Points (+1.0% to +2.5%) | Lower import costs, short-covering, margin expansion across margin-sensitive sectors. |
| Phase 2: Full Accord Signed | Late August 2026 | $68 $72 / bbl | Sustained Bullish Rally | Moderating inflation, increased FII inflows, heightened probability of RBI rate cuts. |
| Negotiations Collapse | Unscheduled / Failed | $95 $100+ / bbl | -350 to -750 Points (-1.5% to -3.0%) | Input cost spikes, weakening Rupee, institutional capital outflows. |
Bottom Line
The Oman-mediated talks between the U.S. and Iran are a critical catalyst for global energy dynamics and Indian stock market sentiment. If a formal transit agreement is announced in the coming days, it will provide a strong foundation for a rally across energy-sensitive sectors and benchmark indices. Market participants should monitor diplomatic briefings, crude oil movements, and institutional flow trends closely as official statements emerge.
Disclaimer: This article is written for educational and informational purposes only and does not constitute financial, investment, or trading advice. Equity markets and commodities are subject to geopolitical volatility. Investors should consult a qualified financial advisor before making investment decisions.