


Master Guide: Decoding the U.S. CPI Release and Its Impact on Global Markets
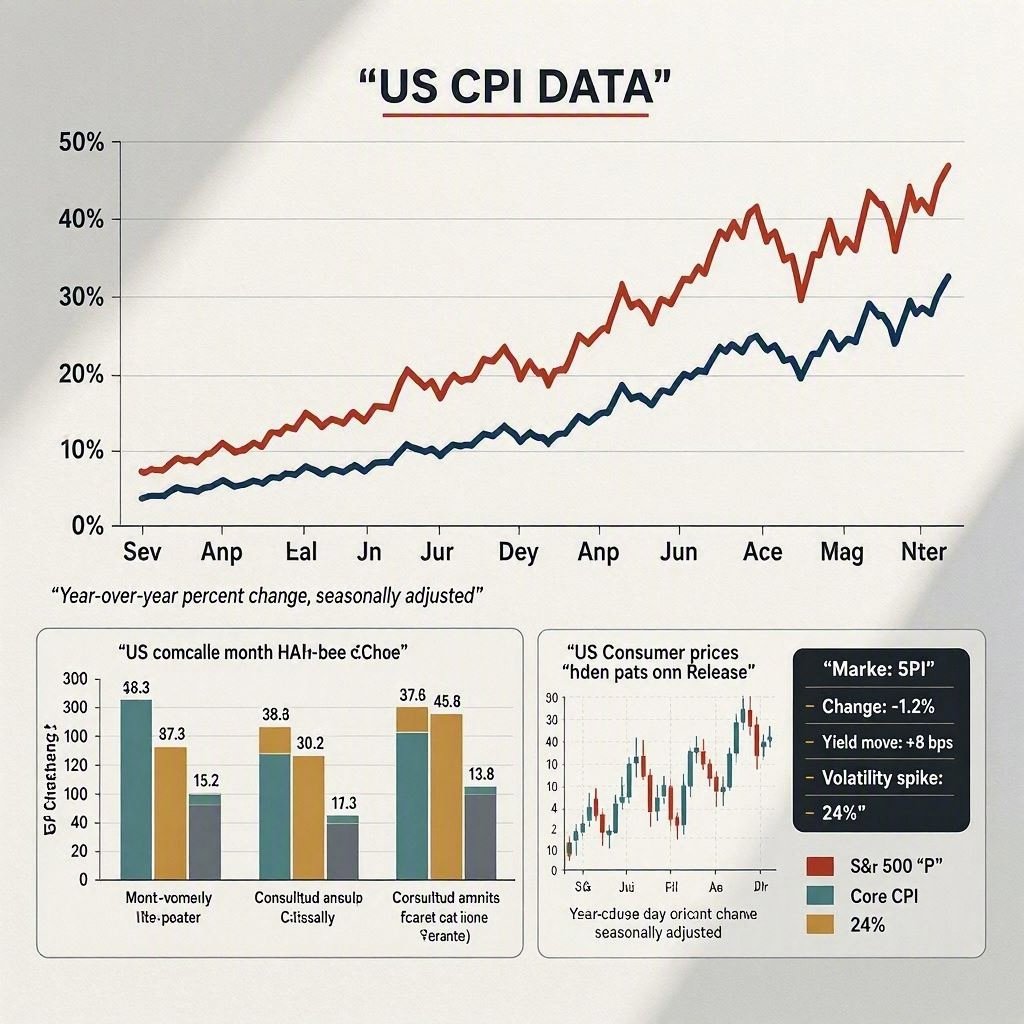
U.S. CPI Data & Market Impact: Complete Guide
For global equity traders, macro analysts, and institutional investors, few economic indicators command as much immediate volatility as the U.S. Consumer Price Index (CPI). Published monthly by the Bureau of Labor Statistics (BLS), this report acts as the ultimate macro compass for inflation, steering Federal Reserve monetary policy, currency strength, and institutional risk appetite worldwide.
Whether you trade large-cap equities on Wall Street or track benchmark indices like the Nifty 50 and S&P BSE Sensex in India, understanding how CPI data releases drive market behavior across asset classes is essential.
1. The Context: Schedule and Current Trends
U.S. CPI Data & Market Impact: Complete Guide
The U.S. Consumer Price Index is published monthly at 8:30 a.m. Eastern Time (ET). Following an unusual monthly contraction in June (driven heavily by a sharp slide in energy and gasoline prices which pulled headline MoM down to -0.4% and YoY to 3.5%), markets closely monitor whether underlying disinflation remains sticky or structural.
Wall Street Consensus Expectations
Markets never trade on raw numbers alone; they trade against expectations:
-
Headline CPI (YoY): Projected to ease slightly to 3.4% (compared to 3.5% previously).
-
Headline CPI (MoM): Expected to register a mild rebound of +0.1% following the previous month’s energy dip.
-
Core CPI (YoY): Estimated to cool down to 2.5% (down from 2.6%).
-
Core CPI (MoM): Forecasted at a modest +0.2% increase.
2. The Core Driver: The “Surprise Factor”
Algorithmic trading desks and institutional funds reprice assets instantly based on how the actual print compares against consensus forecasts:
-
In-Line Data (Matches Forecast): Results in muted or short-term volatility. Because consensus metrics are already priced into asset valuations, initial algorithmic wiggles quickly fade.
-
Softer-Than-Expected (Cooler Inflation): Triggers an immediate “risk-on” rally. Lower inflation expectations fuel optimism regarding aggressive Federal Reserve rate cuts, lowering borrowing costs and expanding equity multiples.
-
Hotter-Than-Expected (Sticky Inflation): Prompts swift defensive positioning. Fears of a “higher-for-longer” rate environment or a hawkish central bank pivot lead to sharp, broad-based liquidations.
3. Global Index Impact Matrix: Points & Percentage (%) Responses
Because major international indices trade at different absolute numerical levels, a uniform percentage shift results in vastly different absolute point swings.
| CPI Surprise Scenario (Deviation) | Market-Wide Percentage Impact (%) | Estimated Point Swing: S&P 500 (~5,500 Base) | Estimated Point Swing: Nasdaq 100 (~18,000 Base) | Estimated Point Swing: Nifty 50 (~24,000 Base) |
| In-Line Data (Matches Expectations) | 0.0% to ±0.2% | ±10 to ±30 pts | ±35 to ±90 pts | ±50 to ±80 pts |
| Small Beat / Miss (±0.1%) | ±0.3% to ±0.6% | ±15 to ±35 pts | ±50 to ±110 pts | ±70 to ±150 pts |
| Moderate Surprise (±0.2%) | ±0.7% to ±1.5% | ±40 to ±80 pts | ±130 to ±270 pts | ±180 to ±360 pts |
| Major Macro Shock (±0.3%+) | ±1.6% to ±3.0%+ | ±90 to ±165+ pts | ±290 to ±540+ pts | ±400 to ±720+ pts |
-
The Nasdaq 100 Sensitivity: Heavily weighted toward high-beta technology and growth enterprises whose future cash flows rely on low discount rates, tech indices absorb the hardest shocks during hot prints and lead the recovery during cool prints.
-
The S&P 500 & Dow Jones: Serving as broader barometers for cyclical and industrial health, they experience moderate point adjustments that heavily impact corporate earnings multiples.
4. The Cross-Border Ripple Effect: Impact on Indian Markets
For international investors tracking emerging markets like India, U.S. inflation data serves as a major macro catalyst primarily through Foreign Portfolio Investor (FPI) activity:
-
The Timing Factor: Released at 8:30 AM Eastern Time (6:00 PM IST), the report lands after Indian market hours.
-
The Opening Bell Effect: Because local exchanges are closed at release, market sentiment is priced into evening futures (such as Gift Nifty) and materializes as a distinct gap-up or gap-down opening the following morning.
-
Vulnerable Sectors:
-
Nifty IT: Reacts aggressively due to direct revenue correlations with U.S. enterprise tech budgets.
-
Nifty Bank: Sensitive to global liquidity shifts and institutional capital reallocation.
-
5. Commodities and the Real-Interest Rate Paradox
Commodities maintain a reciprocal relationship with the CPI report:
-
The Dollar Correlation: Because core commodities (crude oil, industrial metals) are priced globally in U.S. Dollars (USD), a hot CPI print that strengthens the greenback creates immediate headwinds for raw material prices.
-
The Gold Dynamic: While gold is traditionally viewed as an inflation hedge, its short-term price action is heavily dictated by real interest rates (nominal yields minus inflation). If a hot CPI report forces the Federal Reserve to drive nominal yields up faster than inflation rises, real rates jump—putting temporary pressure on bullion.
Frequently Asked Questions (FAQ)
What time is the U.S. CPI data released?
The U.S. Consumer Price Index is published monthly by the Bureau of Labor Statistics (BLS) at 8:30 a.m. Eastern Time (ET).
Why does U.S. CPI impact international stock markets like India?
U.S. inflation dictates global monetary conditions and U.S. Dollar strength. When U.S. inflation prints hot, global yields rise and foreign institutional capital often flows out of emerging markets back into Western fixed-income assets, impacting indices like the Nifty 50.
How do traders measure CPI surprises?
Traders look at the variance between the actual monthly (MoM) or annual (YoY) figures and the consensus forecasts provided by major economic survey trackers.
Disclaimer
This article is provided for informational and educational purposes only and does not constitute financial, investment, or trading advice. Macroeconomic data releases carry substantial market risk, and asset prices can experience extreme volatility following scheduled announcements. Always conduct your own due diligence before making investment decisions.